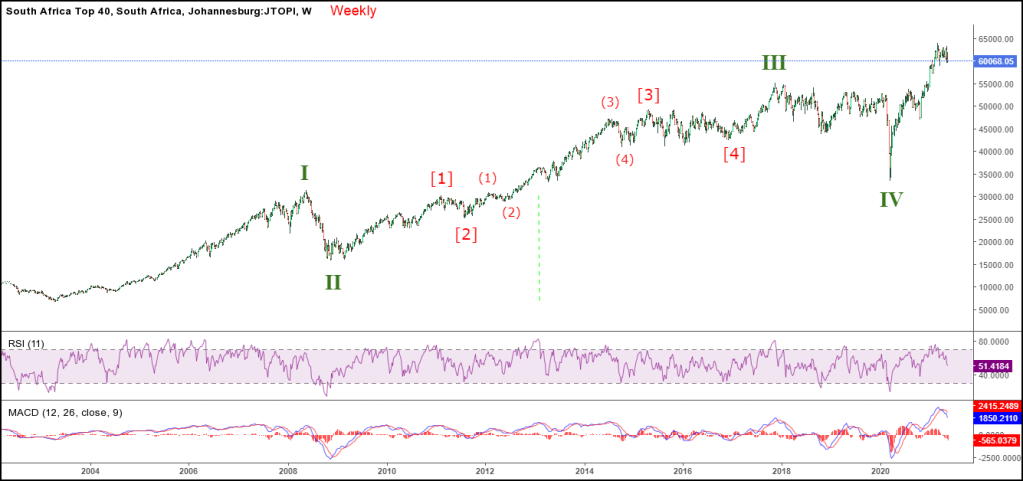
Top 40 Swix - Satrix ETF
The bear trend correcton algos appear to be on holiday.
Posted 28 December 2020 - 08:06 AM
Top 40 Swix - Satrix ETF
The bear trend correcton algos appear to be on holiday.
Posted 27 October 2020 - 11:38 AM
JSE, All Share Index, J203
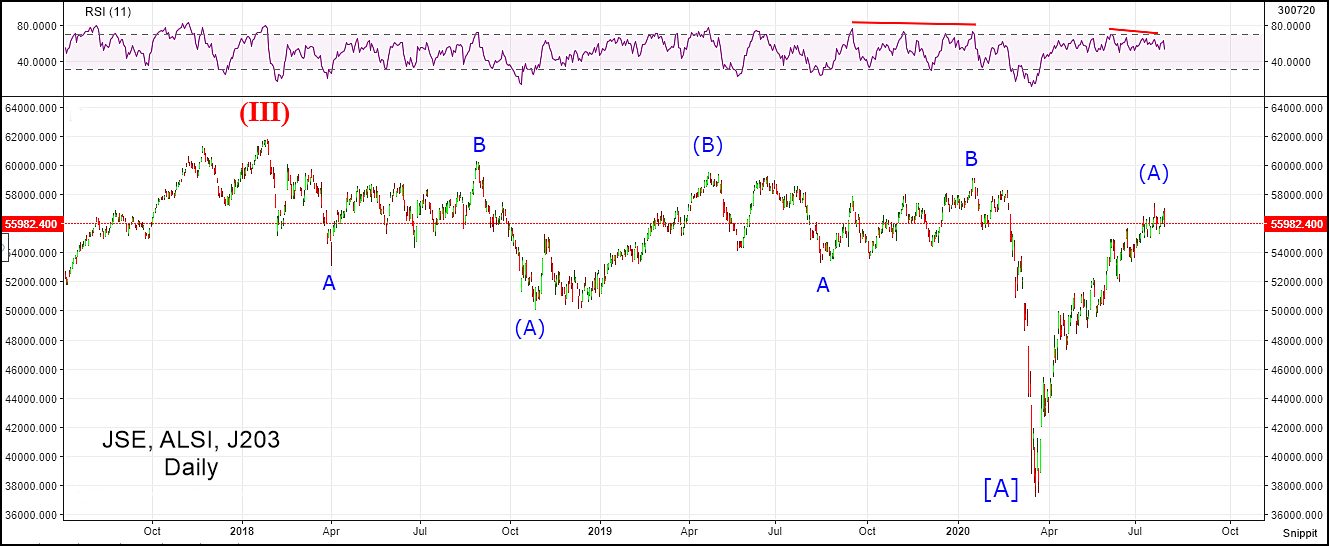
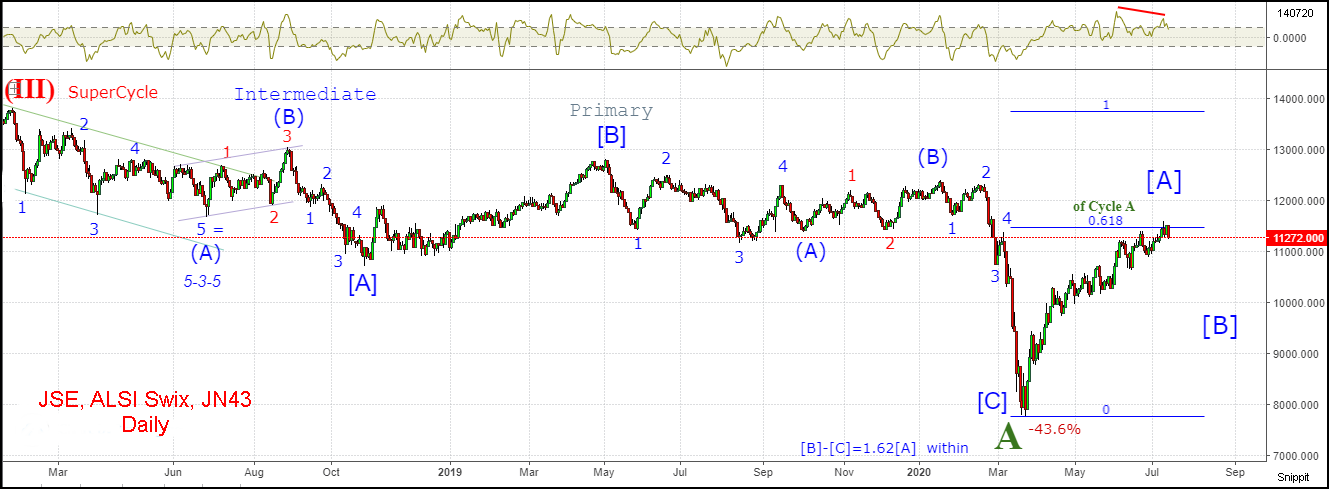
This daily chart plots the course of the Supercycle correction that I have been observing. It is now approaching the completion of 3 years in service.
https://el834862649....are-index-j203/
This first of the 3 larger legs is Cycle A. The projection indicates the prospective target of the 1.62 Fib ratio of Primary [A] for Primary [C]. This compares closely with the ratio of the Intermediate © leg to the associated Intermediate [A] leg.
This could be caused by another and even longer full scale lockdown due to another strain of the virus, already called C-21 by some and even predicted by Mr & Mrs Gates. But I don’t even know how to spell conspiracy. No doubt those in-the-know will buy the dip, like they did before.
Posted 30 July 2020 - 08:24 PM
Posted 14 July 2020 - 04:11 PM
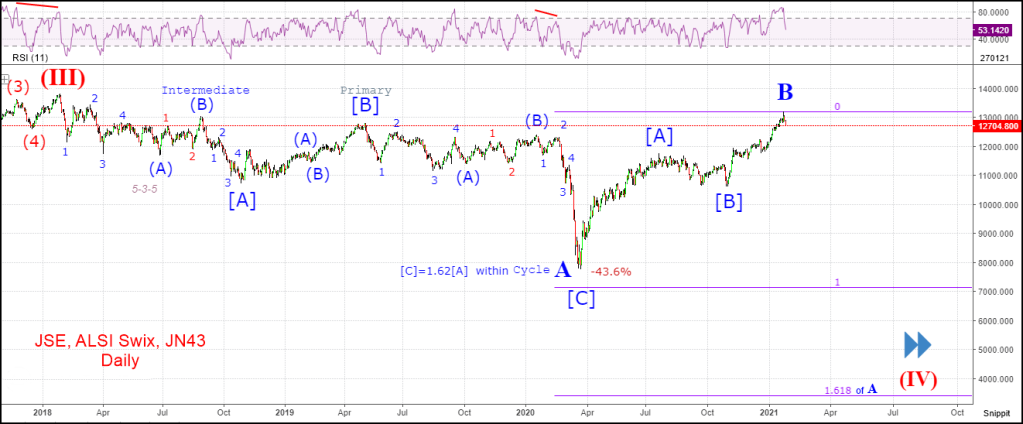
https://jsecharts.bl...-swix-jn43.html
Don't get suckered
Posted 08 June 2020 - 02:41 PM
MSCI Global ETF (Rands)
https://jsecharts.bl...-etf-rands.html
nolite facere quicquam
Edited by Snippit, 08 June 2020 - 02:42 PM.
Posted 29 May 2020 - 02:56 PM
Cool. I hereby bestow upon you free life membership of my fan club. You are both the first life member and first ordinary member. Its all yours so you are also in the Chair. Enjoy.
Love it!!! I'm honored!
Invest in what you know - Warren Buffet
Posted 29 May 2020 - 01:26 PM
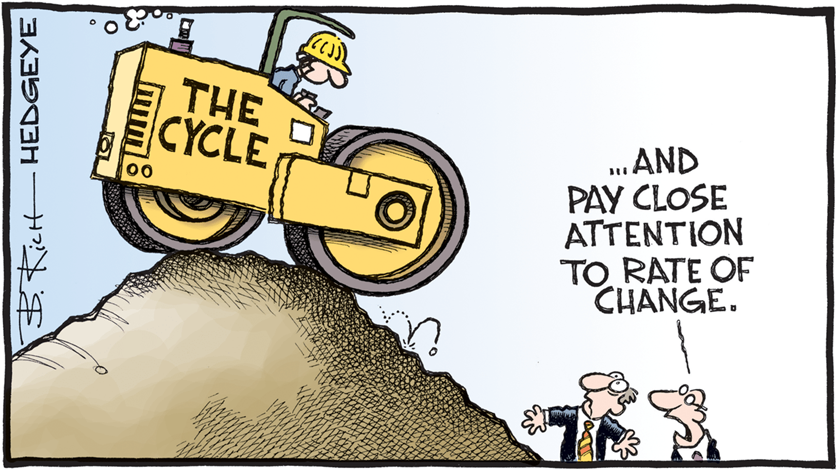
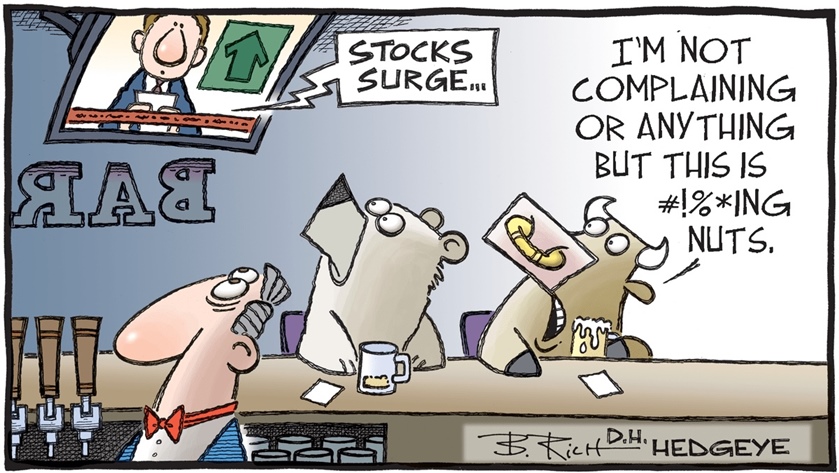
Like the whole post and enjoy your comments........ and I love Hedgeye's witty sense of humor!
Thanks for sharing.....
Cool. I hereby bestow upon you free life membership of my fan club. You are both the first life member and first ordinary member. Its all yours so you are also in the Chair. Enjoy.
Posted 28 May 2020 - 08:31 AM
MSCI Global ETF (Rands)
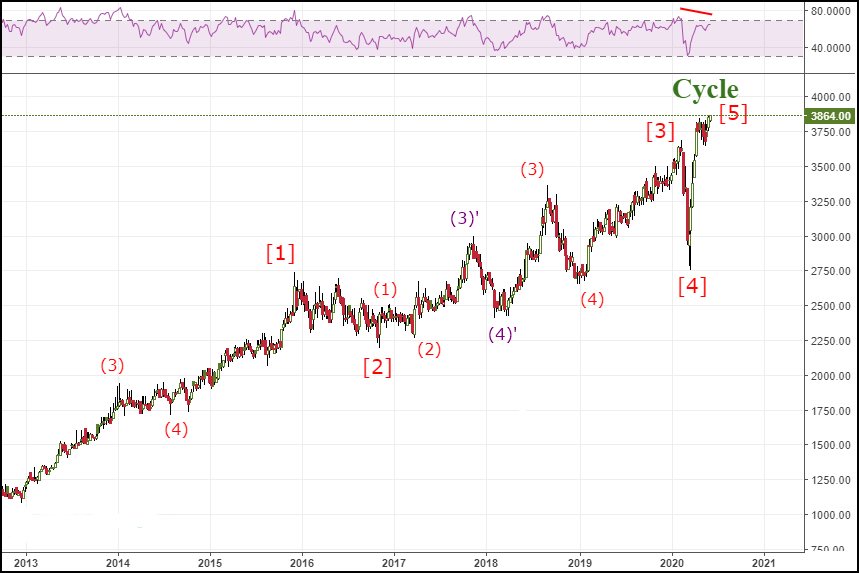
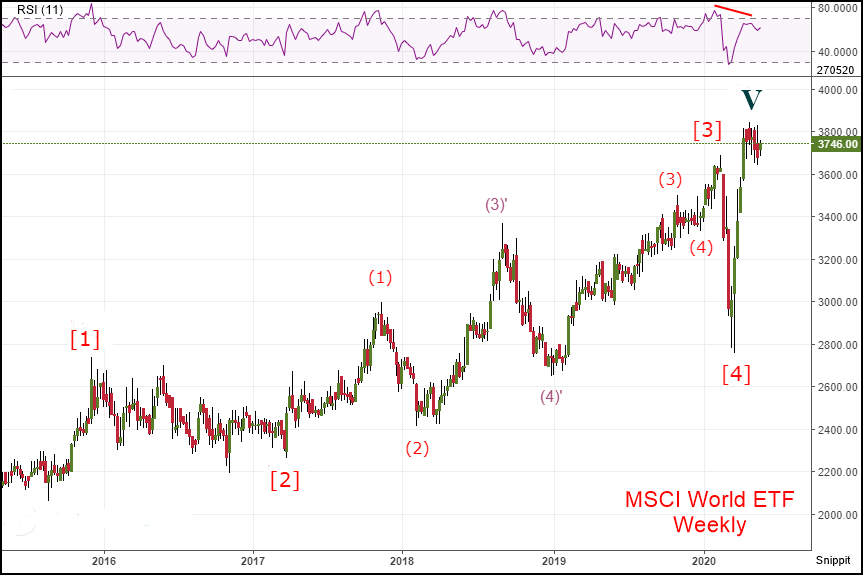
Not the ALSI but a related species with occasional influence.Here is a weekly chart for the Global MSCI ETF in Rands. It appears to have topped out of Cycle V.Primary wave [1] is longest and [5] is accordingly the shortest. It appears to be overly elevated like most 5th waves appear. And yet it tentatively awaits some further confirmation of the expected impact of the global lockdown madness or some second wave panic stations and does not want to leave its station without good cause.On the other hand the hope is that the unprecedented liquidity injections can enable a resurgence of buybacks so as to create the false impressions as usual. More important is that the usual recipients of free cash can buy up the indices and then the economy can go do whatever it wants and zombie scarecrows will rule again.To be expected after over a decade of the same thing. Most traders have never known anything different.
https://jsecharts.bl...-etf-rands.html
A caestu praeiudicatum
Like the whole post and enjoy your comments........ and I love Hedgeye's witty sense of humor!
Thanks for sharing.....
Invest in what you know - Warren Buffet
Posted 27 May 2020 - 03:30 PM
https://jsecharts.bl...-etf-rands.html
A caestu praeiudicatum
Posted 11 May 2020 - 11:26 AM
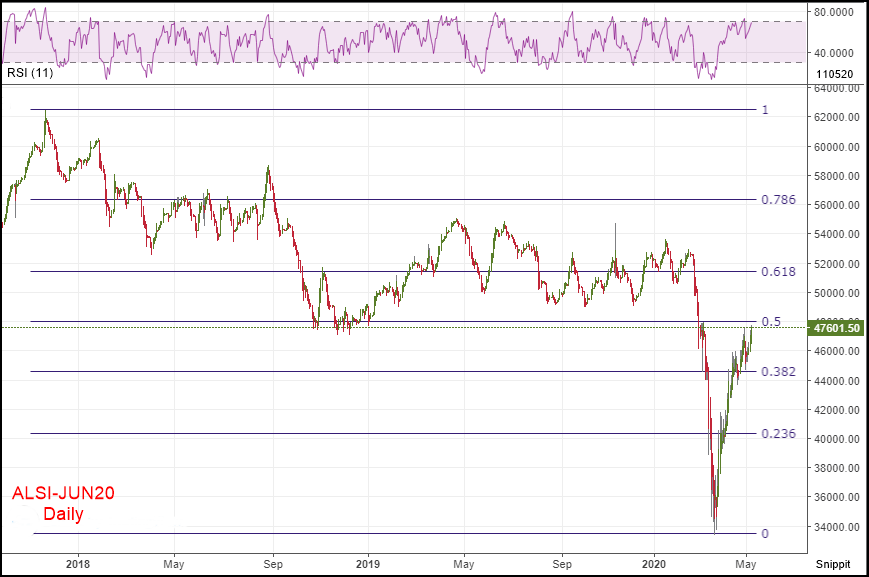
ALSI Futures
https://jsecharts.bl...si-futures.html
facilis desideraturus
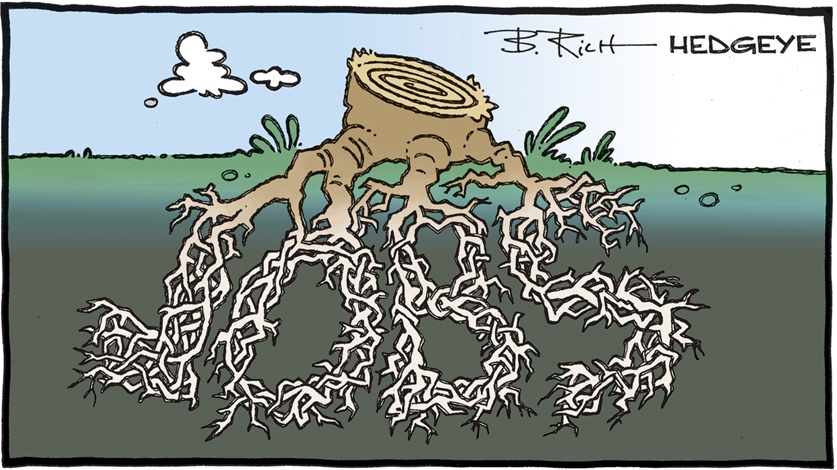
dead roots
Edited by Snippit, 11 May 2020 - 11:30 AM.
Posted 11 May 2020 - 11:16 AM
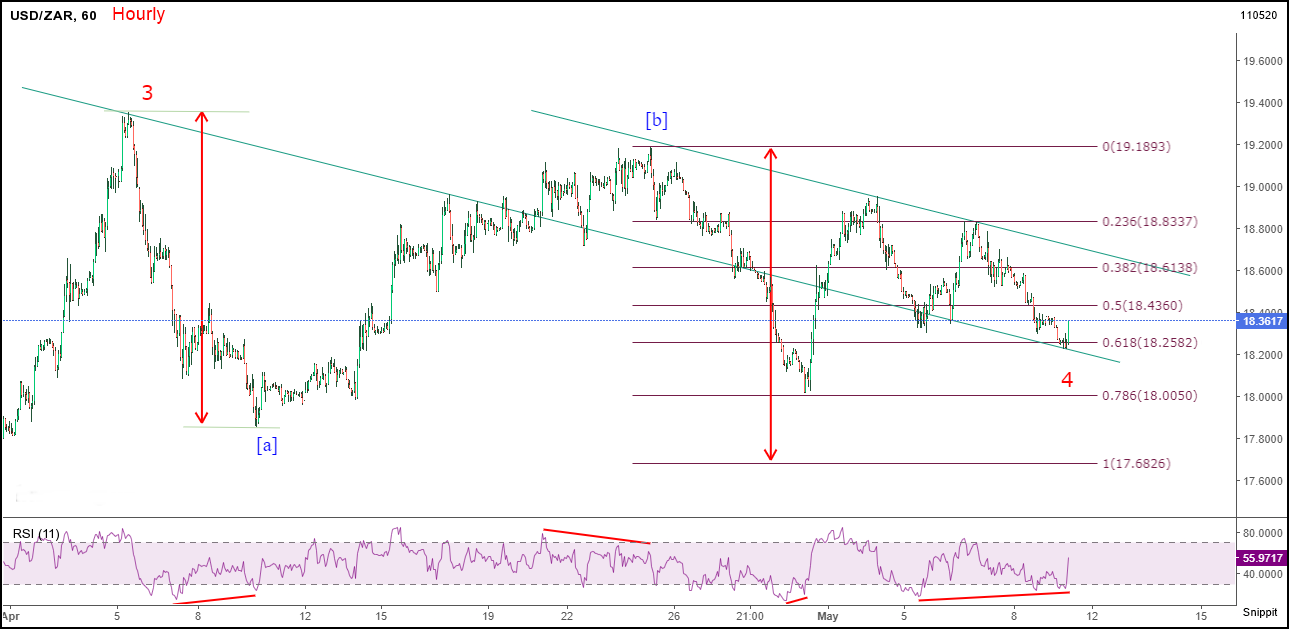
https://jsecharts.bl.../05/usdzar.html
cave cerebrum damnum
Posted 08 May 2020 - 01:47 PM
ALSI Swix, JN43
https://jsecharts.bl...-swix-jn43.html
nolite oblivisci obseres
Edited by Snippit, 08 May 2020 - 01:48 PM.
Posted 08 May 2020 - 01:46 PM
https://jsecharts.bl...-swix-jn43.html
nolite oblivisci obseres
Posted 20 March 2020 - 08:39 AM
Posted 12 March 2020 - 03:41 PM
ALSI down 8.71% for the day.
Everything is falling so violently I have to adjust my screen size to see the bottom of the charts.
I don't think I can take much more of this.
Posted 09 March 2020 - 09:31 PM
https://jsecharts.bl...-swix-jn43.html
accipies confractus est
Posted 02 March 2020 - 07:32 AM
Practitioners for the standard Elliott Wave Theory (EWT) have been tracking the "Super Cycle" chart pattern for US indices since I was much younger. The belief is that this Super Cycle commenced at the bottom of the 1929 crash, which was the end of the corrective for the preceding Super Cycle. Now we see this final end point has arrived. It has evidently been extended by extensive interference which reflects in the chart patterns.
The correlation for the Dow of 6 years ago came and went as we plowed onward and upwards with our new found methods of interference, viz:
https://www.marketwa...tion-2014-02-11
The crash that was to be has been delayed and increased in prospective dimension by the additional upward action.
Now it is a game of the power potential of new found central bank interference collusion against the over-sized forces of nature. Me thinks Dr Doom is probably going to be proved to also be correct this time.
The correction was sharp at 3 years duration for the 1929 event. The Elliott theory expects alternation of successive corrective patterns and so a 9 year period is more probable this time.
Investors need some appropriate awareness which the dysfunctional "industry" is incapable of providing.
Basically the Titanic is going down, the lifeboats are inadequate and wealth is going to be destroyed like never before.
Posted 26 February 2020 - 09:27 AM
https://jsecharts.bl...-swix-jn43.html
Labellum foraminis
Posted 18 February 2020 - 09:40 AM
JSE ALSI (futures) resumes the correction along with all other ALSI index variants.
https://jsecharts.bl...si-futures.html
alter alter trahere