Thanks Farouk
Also see the 15th as a red hanger sale day!Longs take cover if 43400 (futures) cracks...
A
Is 43400 holding or cracking?? Can't decide whether to cut my longs (VERY red - had to hedge my shorts - margin trouble!)... 


 31 votes
Master


Posted 11 April 2014 - 01:50 PM
Thanks Farouk
Also see the 15th as a red hanger sale day!Longs take cover if 43400 (futures) cracks...
A
Is 43400 holding or cracking?? Can't decide whether to cut my longs (VERY red - had to hedge my shorts - margin trouble!)...
Exi, impie, exi, scelerae, exi cum omnia fallacia tua
The Wizard

Posted 11 April 2014 - 01:48 PM
Advanced Member

Posted 11 April 2014 - 01:43 PM
As the market moves against me, my target changes accordingly. I'm now looking at 43619.
Brothers, this could be the end of civilization as we know it.
PS: I'm long 6 contracts at 43475. Currently I'm down 60 points on each contract. Let's see.
Edited by Roundtree, 11 April 2014 - 01:47 PM.
Happy trading!
Sage

Posted 11 April 2014 - 01:28 PM
i been out...well well well i was short at 670 330 is the next step guys....it's the way I see it...market is puking up it's gluttony....this tech damage and sentiment is taking serious effect. there might be a rigging spike...but it won't have legs...there is nothing fundamentally good about geopolitics, geofinance the worldover. this is the beginning of the 10% correction..and if it not I can assure you the bears and bulls will make scalp money for the next 3 months for the weekly / monthly indics to recover the tech damage. beleive it..this will set up a doji of all doji's for trend change...either continuation (unlikely) or down hard (likely) and who said no one rang the bell at the top...I did on april 8th...ding ding ding ...traders may get an up move...but I doubt for an engulfing. my money would be against it anyways.
I think some players did not hear the bell. Dow will bleed to 15700, S&P500 to 1800
ALSI is hanging on a thread, expect a quick 300 pips down when it breaks
No profession requires more hard work, intelligence, patience, and mental discipline than..speculation.
The Wizard
Posted 11 April 2014 - 01:14 PM
Sage
Posted 11 April 2014 - 01:11 PM
JP Morgan earnings Big Miss
JPM EPS $1.28, Exp. $1.38, Revenue $23.9 Exp. $24.49bn
More petrol to the fire.
Also remember that ALSI is not a leading market, it's a follower.
Leading markets are DAX, Russell 200 and Nasdaq. If you follow those indices, you will see what the laggards will do next.
It only takes 1 trading day to wipe 2 weeks of gains, example of this is yesterdays selloff in the US.
It wiped 1 months gains in less than 8 hours.
Bulls need weeks, but bears need hours.
Hence: bulls climb the stairs and bears jump out the window
No profession requires more hard work, intelligence, patience, and mental discipline than..speculation.
Sage
Posted 11 April 2014 - 12:55 PM
Hi S.
I see the gap at 41200 (Jun 14) thereabout; you may have a point that the drop is here to stay. Don't you think there's a possibility that we may go up to 44000 first before we go down? Remember we haven't taken out the orders at 44170 (Jun 14), shouldn't we hit those first?
Happy trading, brother.
The next 2 sessions wont be too bullish.
But Tuesday might be bullish, as it has been for the last 15 out of 18 session this year.
Also supporting a bullish move on Tuesday is that April is usually weak leading up to April 15th.
Going back 40 years, the average April sees some jitters ahead of the tax man and bottoms on the 14th. This does tend to result in a major low and rally the rest of the month.
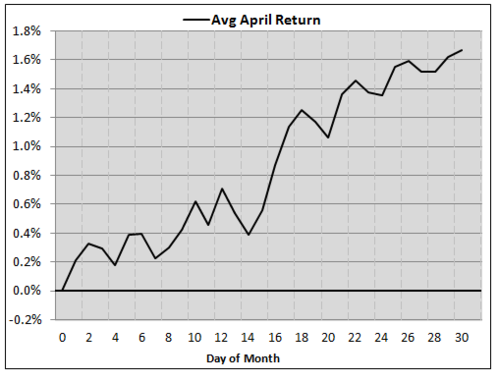
The past 10 years it is even more pronounced. The SPX peaks on April 10 at +1.35% on average and dips till exactly April 15 at 0.59% on average. Once again though, this marks a nice buying opportunity for a month end rally.
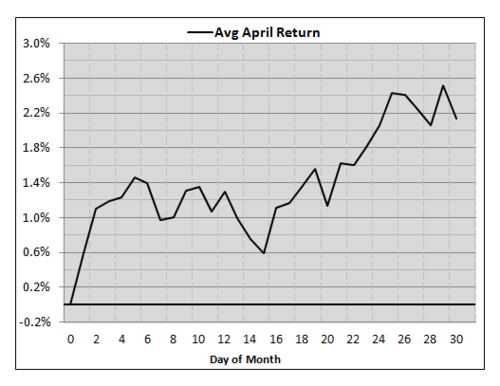
However, next week is option expiration week. Here are the past 10 April returns. Down 3 of past 4

No profession requires more hard work, intelligence, patience, and mental discipline than..speculation.
Sage
Posted 11 April 2014 - 12:46 PM
Farouk
Thanks for the chart. Based on the MACD histogram readings we will require a 2008/2011 type event to go below the zero line in the matter of 1 candle (1 week). So a correction might take weeks to play out, or we need an EVENT. Ukraine, Iran, Japan/China, etc.
I get de ja vu when everyone calls for a correction. Too obvious? And when it comes, very few will believe it!
It's not everyone calling for a correction. Only a few wise traders.
If everyone was bearish you would see extreme bearish signals on sentiment.
Advisors are still bullish.

The S&P 500 sold off more than 2% but VIX up less than 15% and under 16 (lack of fear)
Once the VIX goes above 16 then real fear starts.
This is also a 3.5% decline in the S&P500, so more downside left
No profession requires more hard work, intelligence, patience, and mental discipline than..speculation.
Advanced Member
Posted 11 April 2014 - 12:44 PM
Just woke up, had a nice Asia session with the Nikkei and some forex pairs
The drop is here to last. I'm aiming for 41800 (Cash). We will struggle a bit around 42500-800 (Cash) area before that target is met.
I see your trades are mostly for quick action, i must say we have different visions for our trades. You like quickies and like to stick around until the real joy comes.
Hi S.
I see the gap at 41200 (Jun 14) thereabout; you may have a point that the drop is here to stay. Don't you think there's a possibility that we may go up to 44000 first before we go down? Remember we haven't taken out the orders at 44170 (Jun 14), shouldn't we hit those first?
Happy trading, brother.
Happy trading!
Sage
Posted 11 April 2014 - 12:26 PM
Do we really have to wait til 11h30 to get filled, Mr Market?
Brothers, the thread is quiet; what happened to all the bears? How serious do you think this drop is? Should I also go short and follow the trend?
Just woke up, had a nice Asia session with the Nikkei and some forex pairs
The drop is here to last. I'm aiming for 41800 (Cash). We will struggle a bit around 42500-800 (Cash) area before that target is met.
I see your trades are mostly for quick action, i must say we have different visions for our trades. You like quickies and like to stick around until the real joy comes.
No profession requires more hard work, intelligence, patience, and mental discipline than..speculation.
Advanced Member
Posted 11 April 2014 - 12:13 PM
you meant 6580 ?
I meant 6480, O.
The FTSE has a funny movement; the big orders (long) are waiting at 6480 and the FTSE should shoot up to 6540 thereafter; that's how I would trade it anyway. Of course, the banksters will find some piece of news to justify the huge move; the FED, Ukraine, jobs numbers, anything. Anyway, the current move will top at 6530 from what I can see. But then again, I'm always wrong when it come to these things.
Happy trading, brother.
Happy trading!
Advanced Member

Posted 11 April 2014 - 12:07 PM
A freebie chart for those that understand.
The above chart is my long term indicator for a market crash.
The chart is self explanatory for those that understand.
The divergences on the histograms are the important signals.
The last time i taught the market would crash was in 2011 and the charts confirmed divergences
but the markets was saved by the Bens printing press.
So far there are no divergences to suggest any market crash.
Infact i see pullbacks as buying opportinities.
Note bit takes a lot of my time and effort to put up charts like these and i don't think you going to see them again.
Argento
I know cycles are confirming market to correct this year but my opinion is it will only happen if some major event
takes place.Maybe a war and we all know the tensions between Russia and West at present.Or maybe war in middle east
between Israel and Iran.Note i did mention abour 15th April and one needs to study history about blood red moon lunar eclipses.because 15th April is the beginning of a tetrad of lunar eclipses which will end in September next year.Note i am not saying war will breakout but what i am saying is anything possible and it will effect markets.Futher the ball is in the feds court.They call the shots.Any interest rate hike which will lead to tightening of margin debt will be a start to market decline.
At present i don't advise anyone to be in long term trades.Short term trades with tight stop losses is the way to go.
Just my 2cents.
Farouk
Thanks for the chart. Based on the MACD histogram readings we will require a 2008/2011 type event to go below the zero line in the matter of 1 candle (1 week). So a correction might take weeks to play out, or we need an EVENT. Ukraine, Iran, Japan/China, etc.
I get de ja vu when everyone calls for a correction. Too obvious? And when it comes, very few will believe it!
The Artist

Posted 11 April 2014 - 12:02 PM
A freebie chart for those that understand.
The above chart is my long term indicator for a market crash.
The chart is self explanatory for those that understand.
The divergences on the histograms are the important signals.
The last time i taught the market would crash was in 2011 and the charts confirmed divergences
but the markets was saved by the Bens printing press.
So far there are no divergences to suggest any market crash.
Infact i see pullbacks as buying opportinities.
Note bit takes a lot of my time and effort to put up charts like these and i don't think you going to see them again.
Argento
I know cycles are confirming market to correct this year but my opinion is it will only happen if some major event
takes place.Maybe a war and we all know the tensions between Russia and West at present.Or maybe war in middle east
between Israel and Iran.Note i did mention abour 15th April and one needs to study history about blood red moon lunar eclipses.because 15th April is the beginning of a tetrad of lunar eclipses which will end in September next year.Note i am not saying war will breakout but what i am saying is anything possible and it will effect markets.Futher the ball is in the feds court.They call the shots.Any interest rate hike which will lead to tightening of margin debt will be a start to market decline.
At present i don't advise anyone to be in long term trades.Short term trades with tight stop losses is the way to go.
Just my 2cents.
Thanks Farouk
Also see the 15th as a red hanger sale day!Longs take cover if 43400 (futures) cracks...
A
Edited by Argento, 11 April 2014 - 12:03 PM.
"Never never never give up!"
Master

Posted 11 April 2014 - 12:01 PM
We may have to wait just a little bit longer for our boys in London to get to 6480 before making our way up.
A rigged market it is, and that's what makes it interesting. Smoke and mirrors, that's all.
You can still go long guys; it's not too late.
you meant 6580 ?
Advanced Member
Posted 11 April 2014 - 11:51 AM
We may have to wait just a little bit longer for our boys in London to get to 6480 before making our way up.
A rigged market it is, and that's what makes it interesting. Smoke and mirrors, that's all.
You can still go long guys; it's not too late.
Happy trading!
The Oracle

Posted 11 April 2014 - 11:30 AM
A freebie chart for those that understand.
 reno.PNG 77.84KB
42 downloads
reno.PNG 77.84KB
42 downloads
The above chart is my long term indicator for a market crash.
The chart is self explanatory for those that understand.
The divergences on the histograms are the important signals.
The last time i taught the market would crash was in 2011 and the charts confirmed divergences
but the markets was saved by the Bens printing press.
So far there are no divergences to suggest any market crash.
Infact i see pullbacks as buying opportinities.
Note bit takes a lot of my time and effort to put up charts like these and i don't think you going to see them again.
Argento
I know cycles are confirming market to correct this year but my opinion is it will only happen if some major event
takes place.Maybe a war and we all know the tensions between Russia and West at present.Or maybe war in middle east
between Israel and Iran.Note i did mention abour 15th April and one needs to study history about blood red moon lunar eclipses.because 15th April is the beginning of a tetrad of lunar eclipses which will end in September next year.Note i am not saying war will breakout but what i am saying is anything possible and it will effect markets.Futher the ball is in the feds court.They call the shots.Any interest rate hike which will lead to tightening of margin debt will be a start to market decline.
At present i don't advise anyone to be in long term trades.Short term trades with tight stop losses is the way to go.
Just my 2cents.
Advanced Member
Posted 11 April 2014 - 11:21 AM
Filled! 6 contracts at 43475. My target is 43715.
Happy trading!
The Artist
Posted 11 April 2014 - 11:21 AM
That looks like a profitable trade. And I can see the MACD is looking bearish. Do the Bollinger Bands confirm your thinking though? Sorry to ask but I only trade naked charts and as a result I cannot make out what they are saying.
Thanks, A.
Yip, she touched the 5H top bollingerband and coming down now!
Uptrendlines more important than bollingerbands though...
I see this as just a retest again before pushing higher!EM's actually very bullish at the moment and holding strong against the other indexes..that is why new highs in the US is very possible after next week seasonal low!
A
"Never never never give up!"
Advanced Member
Posted 11 April 2014 - 11:13 AM
Double Top!
Look where the trendlines meet....that is my target for my shorts!
A
That looks like a profitable trade. And I can see the MACD is looking bearish. Do the Bollinger Bands confirm your thinking though? Sorry to ask but I only trade naked charts and as a result I cannot make out what they are saying.
Thanks, A.
Happy trading!
Advanced Member
Posted 11 April 2014 - 11:04 AM
42800 futures yes..is also where an important uptrend line lies!
The market is like a puzzle, figure out the pattern and you know the count!
I see a mini double top formation confirmed and should guide us there into next week, VIX is high so calls for volatility on the cards and means the moves can get big!
US not done with their downside as well!
A
I see what you mean, A. However I think 42800 has already been played. Of course I may be wrong. If the old traders say 42800, then it's probably the way to go.
Thanks brother.
Happy trading!


