Me too 125 pointer.

ALSI Trades
#21041

Posted 02 April 2014 - 09:44 AM
#21042

Posted 02 April 2014 - 09:30 AM
IG CASH
#21043

Posted 02 April 2014 - 09:23 AM
Accumulating shorts above 43600..
"The Stock Market is never obvious. It is designed to fool most of the people, most of the time." - Jesse Livermore.
#21044

Posted 02 April 2014 - 09:12 AM
Morning All
Anyone going long for 150 pointd this morining?
#21045

Posted 02 April 2014 - 03:32 AM
Why Bullish April will be tricky
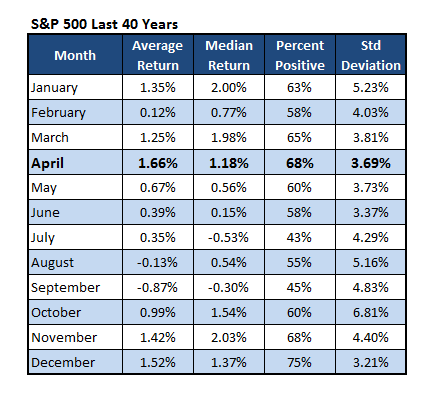
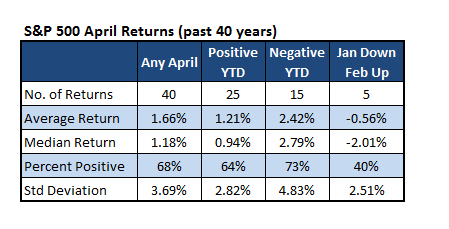
The past 40 years April is the strongest month, up +1.66% on average and higher 68% of the time.
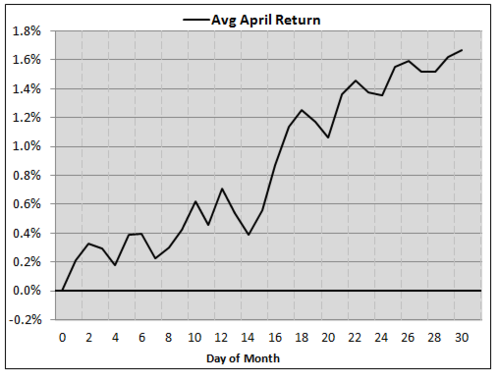
Here’s what the average month looks like over the past 40 years. Pretty much a 45% angle straight up.
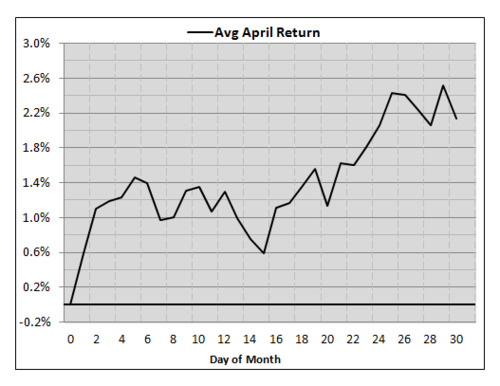
Here’s the average April over the past decade. Notice it is extremely strong early
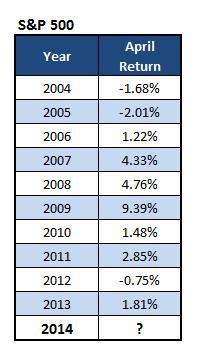
Some of these recent returns are awesome.
Remember this is the second year of the Presidential cycle. Going back to 1949, April isn’t quite as strong, as it is ranks seven out of 12.
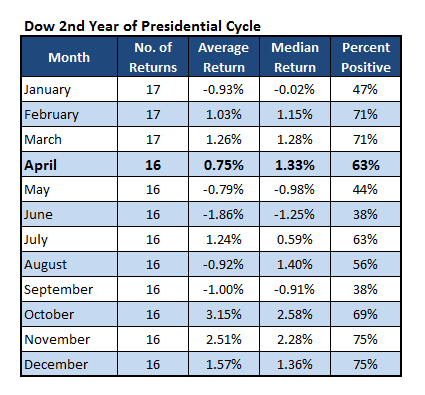
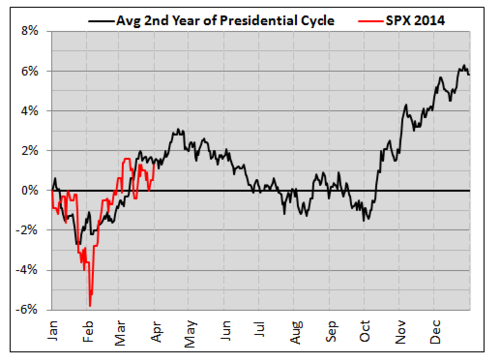
I find this chart amazing. Going back to 1975, here’s what the average second year of the Presidential cycles does. This year is following this trend pretty much exactly. If that is the case, April should see a big pop higher.
Lastly, here are some final ways to look at April. It actually does twice as well when the SPX is negative YTD heading into it. So that doesn’t bode as well this year. But the big one that gets me is what happens when we have a down January/up February (like ‘14). This is rare, as January is usually strong and February isn’t. So when things are turned upside down, the usually strong month of April actually is negative!
No profession requires more hard work, intelligence, patience, and mental discipline than..speculation.
#21046

Posted 01 April 2014 - 10:46 PM
S&P closes at an all time high
It made its 7th new all-time high in 2014. '1995 still has the record at 77 and '2013 checked in at 45
Keep an eye at year 2000 and 2007 number of all time highs. Those are the years when market crashed.

No profession requires more hard work, intelligence, patience, and mental discipline than..speculation.
#21047

Posted 01 April 2014 - 10:33 PM
Medium to long term is good for a big account.
I made a lot of money scalping the bull market last year. This year i am more medium term on the bearish side. That's why i said skep tewyl dit reen in the 2013 October-December bull run
Now i place a trade and relax.
You are a trader of note my man. You called that cap on Friday almost to the point.
Quite happy to do intraday longs and or shorts...as I said, still learning.
Here is a new one for you: As die reen beging ophou? Moenie huil nie!
IG SA40
#21048

Posted 01 April 2014 - 10:30 PM
Hey AJ, you the ShareNet winner this month?
Mmmm. Jy het my hier... April fool much? What is this? haha ![]()
Edited by AJS, 01 April 2014 - 10:31 PM.
#21049

Posted 01 April 2014 - 09:50 PM
Hi guys (and girls) New to the forum but have been following you for some time. Have come to the realization that I can do my M in Finance based on this forum:lol:
:lol: Masters in Psychology as well...
Very insightful and has helped me a lot. I have been riding this uptrend for a long time and cashed in big time... My question though will the impending dive in markets be associated with a strengthening or weakening in R/$? My R/$ positions have been chowing up ALSI profit faster than it can be generated....
The sell off will make the Rand weak. We might go over R11 again.
I took a long position on the USD/ZAR pair from 10.53 target is 11 stop 10.25
There is a inverse HS on the 4H chart
No profession requires more hard work, intelligence, patience, and mental discipline than..speculation.
#21050

Posted 01 April 2014 - 09:47 PM
Great to hear from you Chubby! Thank you!
Big difference between short term and long term (trading/investing).
For me, S' graph is a great looking leading indicator from a week/month plus point of view. By far, most of my money sits in the long term investment space beyond the influence of stop loss hunters and stock operators. For me, the indicator S posted is very handy.
In the trading space (really short term positions like less than a month or so), well, I still have lots to learn and am more interested in scalping than taking a solid position with or against a market for any period beyond a day or so...I don't think I will ever be able to get my head around large daily trading losses as they mount, yet I find no difficulty whatsoever in seeing investment account fluctuations of up to R100k either side occurring because in the long run each of those shares I have a position in was bought for a long term reason, not a quick buck.
In my case, when it comes to trading, then for the moment its exactly like Mhlato says, "the market always proves you wrong...just before it proves you right"
Still learning and thankfully, not paying too much for the course.
Medium to long term is good for a big account.
I made a lot of money scalping the bull market last year. This year i am more medium term on the bearish side. That's why i said skep tewyl dit reen in the 2013 October-December bull run
Now i place a trade and relax.
No profession requires more hard work, intelligence, patience, and mental discipline than..speculation.
#21051

Posted 01 April 2014 - 09:42 PM
Very insightful and has helped me a lot. I have been riding this uptrend for a long time and cashed in big time... My question though will the impending dive in markets be associated with a strengthening or weakening in R/$? My R/$ positions have been chowing up ALSI profit faster than it can be generated....
#21052

Posted 01 April 2014 - 09:41 PM
If u going to play short long term at least don't get excited until you have seen the red bikini top on a daily chart - pull up the Commodity Channel index to see those bikini tops and you will see why New Highs always hunt in pairs. SP500 had a FULL gap up on the daily as well..
Great to hear from you Chubby! Thank you!
Big difference between short term and long term (trading/investing).
For me, S' graph is a great looking leading indicator from a week/month plus point of view. By far, most of my money sits in the long term investment space beyond the influence of stop loss hunters and stock operators. For me, the indicator S posted is very handy.
In the trading space (really short term positions like less than a month or so), well, I still have lots to learn and am more interested in scalping than taking a solid position with or against a market for any period beyond a day or so...I don't think I will ever be able to get my head around large daily trading losses as they mount, yet I find no difficulty whatsoever in seeing investment account fluctuations of up to R100k either side occurring because in the long run each of those shares I have a position in was bought for a long term reason, not a quick buck.
In my case, when it comes to trading, then for the moment its exactly like Mhlato says, "the market always proves you wrong...just before it proves you right"
Still learning and thankfully, not paying too much for the course.
IG SA40
#21053

Posted 01 April 2014 - 09:40 PM
If u going to play short long term at least don't get excited until you have seen the red bikini top on a daily chart - pull up the Commodity Channel index to see those bikini tops and you will see why New Highs always hunt in pairs. SP500 had a FULL gap up on the daily as well..
any chance of sending a image of such a red bikini top Chubby , ? just so I know exactly what you mean - Thanks
#21054

Posted 01 April 2014 - 09:24 PM
he he ![]()
ek ook gewonder!!! haha
From your perspective, Lekkerry is faceless and to a degree nameless, so any opinions expressed are just that, opinions from someone on the Internet ![]()
#21055

Posted 01 April 2014 - 09:21 PM
I was hoping for strong short squeeze on S&P500 at 1883 - did not happen , nor can there be a shortage of shorts that may need short covering either! so answer is that short cover kick off starts higher , say 1891ish .
but to pass baton to further bull moves from that short cover would require existing Cash to be convinced of the merits of committing to equities from those dizzy heights, without that happening then fall back to 1850 and the bears or consolidation I guess! so my strategy is to play this clear bull momentum, keep my T40F's longs until after short cover and then close and see if we fall back , or existing Cash piles into equities. well that the idea until events or my insight change
#21056

Posted 01 April 2014 - 07:38 PM
Very interesting chart indeed.
But lets look at what the chart is not telling us.
In the 2 corrections of 2000 and 2007 when debt reached a peak the market made a new high the following month.
I have drawn 2 black lines to show you what the market did after debt peaked.
Simply put it do not pre-empt the drop because if you do then Mr Market Maker will drop your pants.
100% Farouk. The big drops occurred shortly after each of these events - for me they are leading indicators.
As a long term holder, the loss of the potential little bit of additional profit would have been quite acceptable compared to the big loss that would have had to be carried after the drop if I was a seller.
It worked for me back in 08 and 09 (that time I was watching sky high historic USA house price graphs from Fortune magazine).
Anyway, we all have different decision drivers. Long positions using credit at these heights is too dicey for me unless I am personally monitoring things on my screen during the day. I don't subscribe to stop loss unless I have to leave the screen.
IG SA40
#21057

Posted 01 April 2014 - 07:27 PM
Hey AJ, you the ShareNet winner this month?
Would maybe the nicely coincide with the top as A is calling it (towards end April).
ek ook gewonder!!! haha
The first goal is to ensure survival – avoid the risks that can empty your account and put you out of the trading business. ![]()
#21058

Posted 01 April 2014 - 07:21 PM
Hey AJ, you the ShareNet winner this month?
![]()
Would maybe the nicely coincide with the top as A is calling it (towards end April).
From your perspective, Lekkerry is faceless and to a degree nameless, so any opinions expressed are just that, opinions from someone on the Internet ![]()
#21059

Posted 01 April 2014 - 07:20 PM
Avg Yr 2 of Election cycle shows a peak on the 18th of Apr, down until Oct, then yr-end rally
Spot on!!
And with all the cycles (60yr, 7yr, 4yr) bottoming together this year and QE3 ending (Sept) it makes up for a big bear leg down coming!
A
Wonder if the Fed was clever enough to work that out all by themselves...
Sent from my GT-P5100 using Sharenet Sharechat mobile app
I find trading like body surfing, catch the right one and you will make it all the way to the beach.
#21060

Posted 01 April 2014 - 07:05 PM
 charting.PNG 474.12KB
50 downloads
Very interesting chart indeed.
But lets look at what the chart is not telling us.
In the 2 corrections of 2000 and 2007 when debt reached a peak the market made a new high the following month.
I have drawn 2 black lines to show you what the market did after debt peaked.
Simply put it do not pre-empt the drop because if you do then Mr Market Maker will drop your pants.


