Weird that S&P has not shown short covering rush yet. That level must lie somewhere - thought it was at 1883, and now 1890 still not - there are lots of S&P500 bears out there , and seemingly self assured it seems and 1890 level does not seem to rattle them to cover!. so it seems short cover must be shifted up to 1903 then?
Just remember institutions are not the ones pushing the market up. Dumb money is pushing it up.
The big boys are cashing in. Selling to Mom & Pop as it goes higher.
Big boys were long from 2009, time to sell to Dumb money low hanging fruit.
CFTC reports that insider selling as reached 25%, a level not seen in history before.
I wonder what will happen when all Households are fully invested in the market.
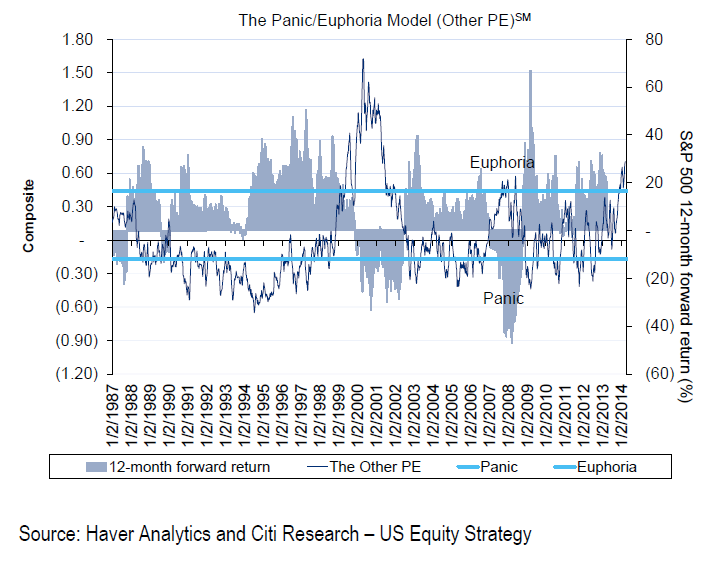
Panic/Euphoria model is reaching new 14-year highs,this implies negative 12-month forward returns.
April normally ends flat or a 1.5 percent gain. Chances are by end of April we might be lower that were we are now or flat.
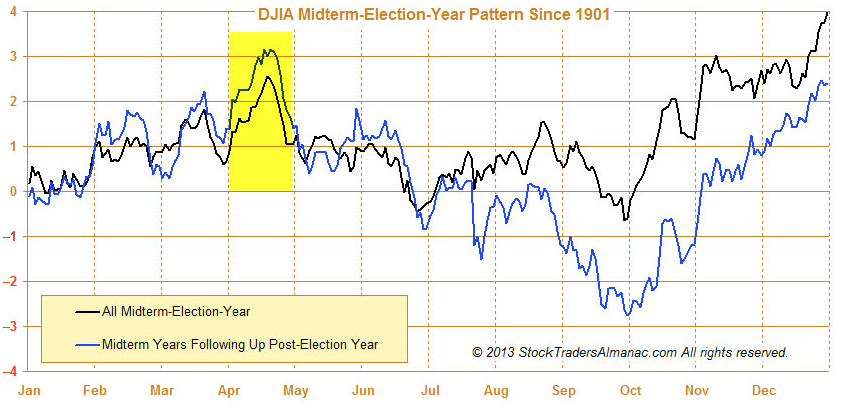
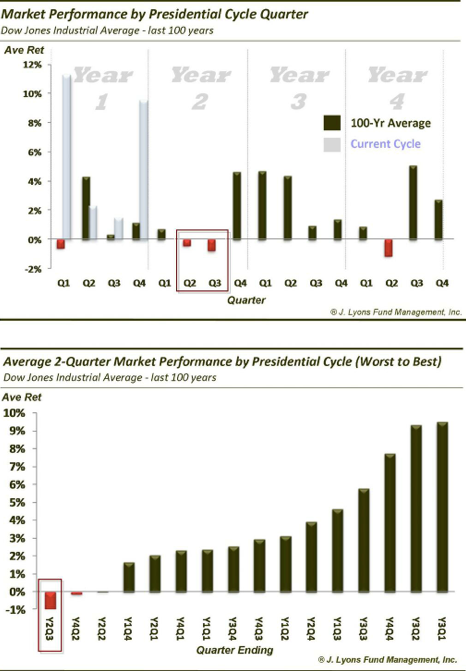
From there, seasonality becomes very bearish. You can see in the chart above and in the one below that the best three months of the year are now past. The next six months are toughest. It is not encouraging that equities have struggled against this positive backdrop heading into the next two quarters. This pattern fits the larger context of the current market, one where equities are unlikely to run substantially higher in the next several months
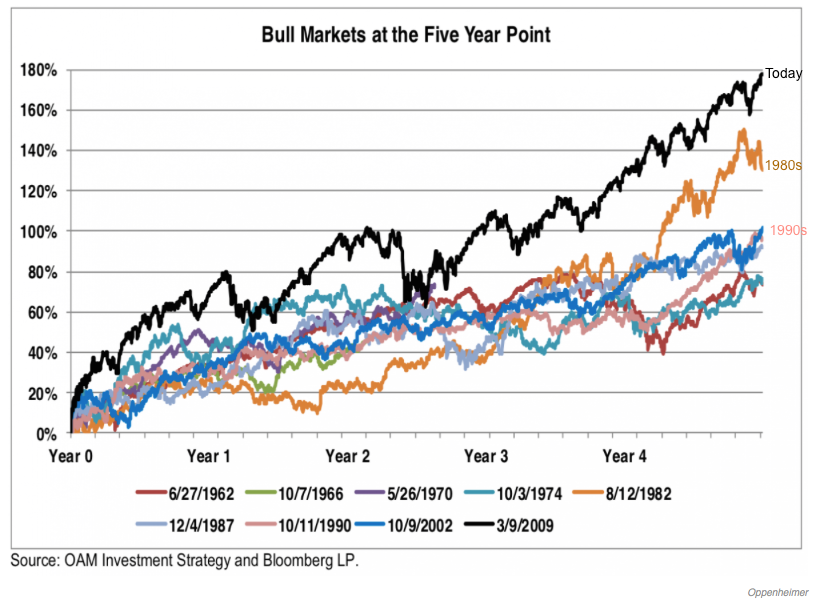
The current cyclical bull market is not just extended in length (at over 5 years), but extended in terms of gains; relative to every bull market since 1960, the gains since 2009 are by far the greatest. An extended pause would be normal.